DimensionX
New member
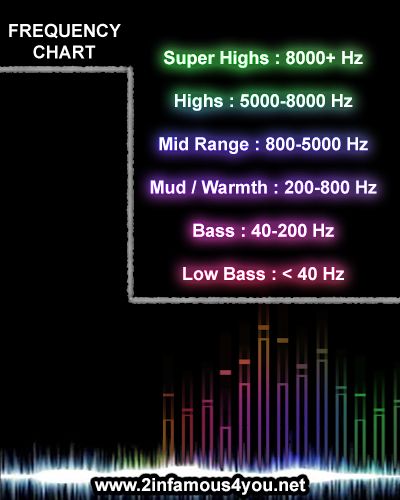
I've found a couple of these on the internet and some are different from eachother... Why is that? Do you have other charts? What chart would you say is the most accurate? Im looking for one that shows the low mids and highs like the ones I provided..
![Screen_Shot_2013-06-25_at_4_zps62xhdqof.jpg](https://i113.photobucket.com/albums/n204/saneoner/Screen_Shot_2013-06-25_at_4_zps62xhdqof.jpg)
![Eq1_zpsojrpxu6m.jpg](https://i113.photobucket.com/albums/n204/saneoner/Eq1_zpsojrpxu6m.jpg)
![Frequency-Chart_zpsjd8f0g4p.jpg](https://i113.photobucket.com/albums/n204/saneoner/Frequency-Chart_zpsjd8f0g4p.jpg)
![EQ_Chart2_converted_zps0gz2iqo7.jpg](https://i113.photobucket.com/albums/n204/saneoner/EQ_Chart2_converted_zps0gz2iqo7.jpg)
![moulton_spectum_zpsznzcwk9d.jpg](https://i113.photobucket.com/albums/n204/saneoner/moulton_spectum_zpsznzcwk9d.jpg)
![EQ_Chart1_converted_zpsdlmqubqq.jpg](https://i113.photobucket.com/albums/n204/saneoner/EQ_Chart1_converted_zpsdlmqubqq.jpg)
![Frequency_Chart1_converted_zpso4rnmpr3.jpg](https://i113.photobucket.com/albums/n204/saneoner/Frequency_Chart1_converted_zpso4rnmpr3.jpg)
![Screen_Shot_2015-04-12_at_4_zpscjdyj9kn.jpg](https://i113.photobucket.com/albums/n204/saneoner/Screen_Shot_2015-04-12_at_4_zpscjdyj9kn.jpg)
![BehringerEQGuide_zps5ugzttwm.jpg](https://i113.photobucket.com/albums/n204/saneoner/BehringerEQGuide_zps5ugzttwm.jpg)